UI/UX Design & Data Visualization
Reservation Summary Hub for OpenTable
A dining record with personalized personas and badge achievements.
Year :
2026
Industry :
Food & Hospitality
Tool :
Figma
Project Duration :
Sep 2026 - Ongoing

Problem
Many diners use restaurant reservation apps to discover restaurants and make reservations. While the reservation process is straightforward, the experience largely ends once the reservation is made.
This project explores how OpenTable could extend beyond reservations by turning a user’s dining history into a more personal and engaging experience. By bringing past reservations together, the app analyzes patterns to create a personalized dining persona and badges.
Goals
Summarize the Reservation History | Create a Personal Dining Persona | Celebrate with Badge Achievement |
|---|---|---|
Turn scattered history into clear insights about cuisines, locations, spending, dining groups, and review patterns. | Use dining patterns to create a persona that helps users understand how they typically experience restaurants. | Turn dining behaviors into badges that encourage exploration and give users a fun way to track their progress. |

Wireframe: Sketches to Screen
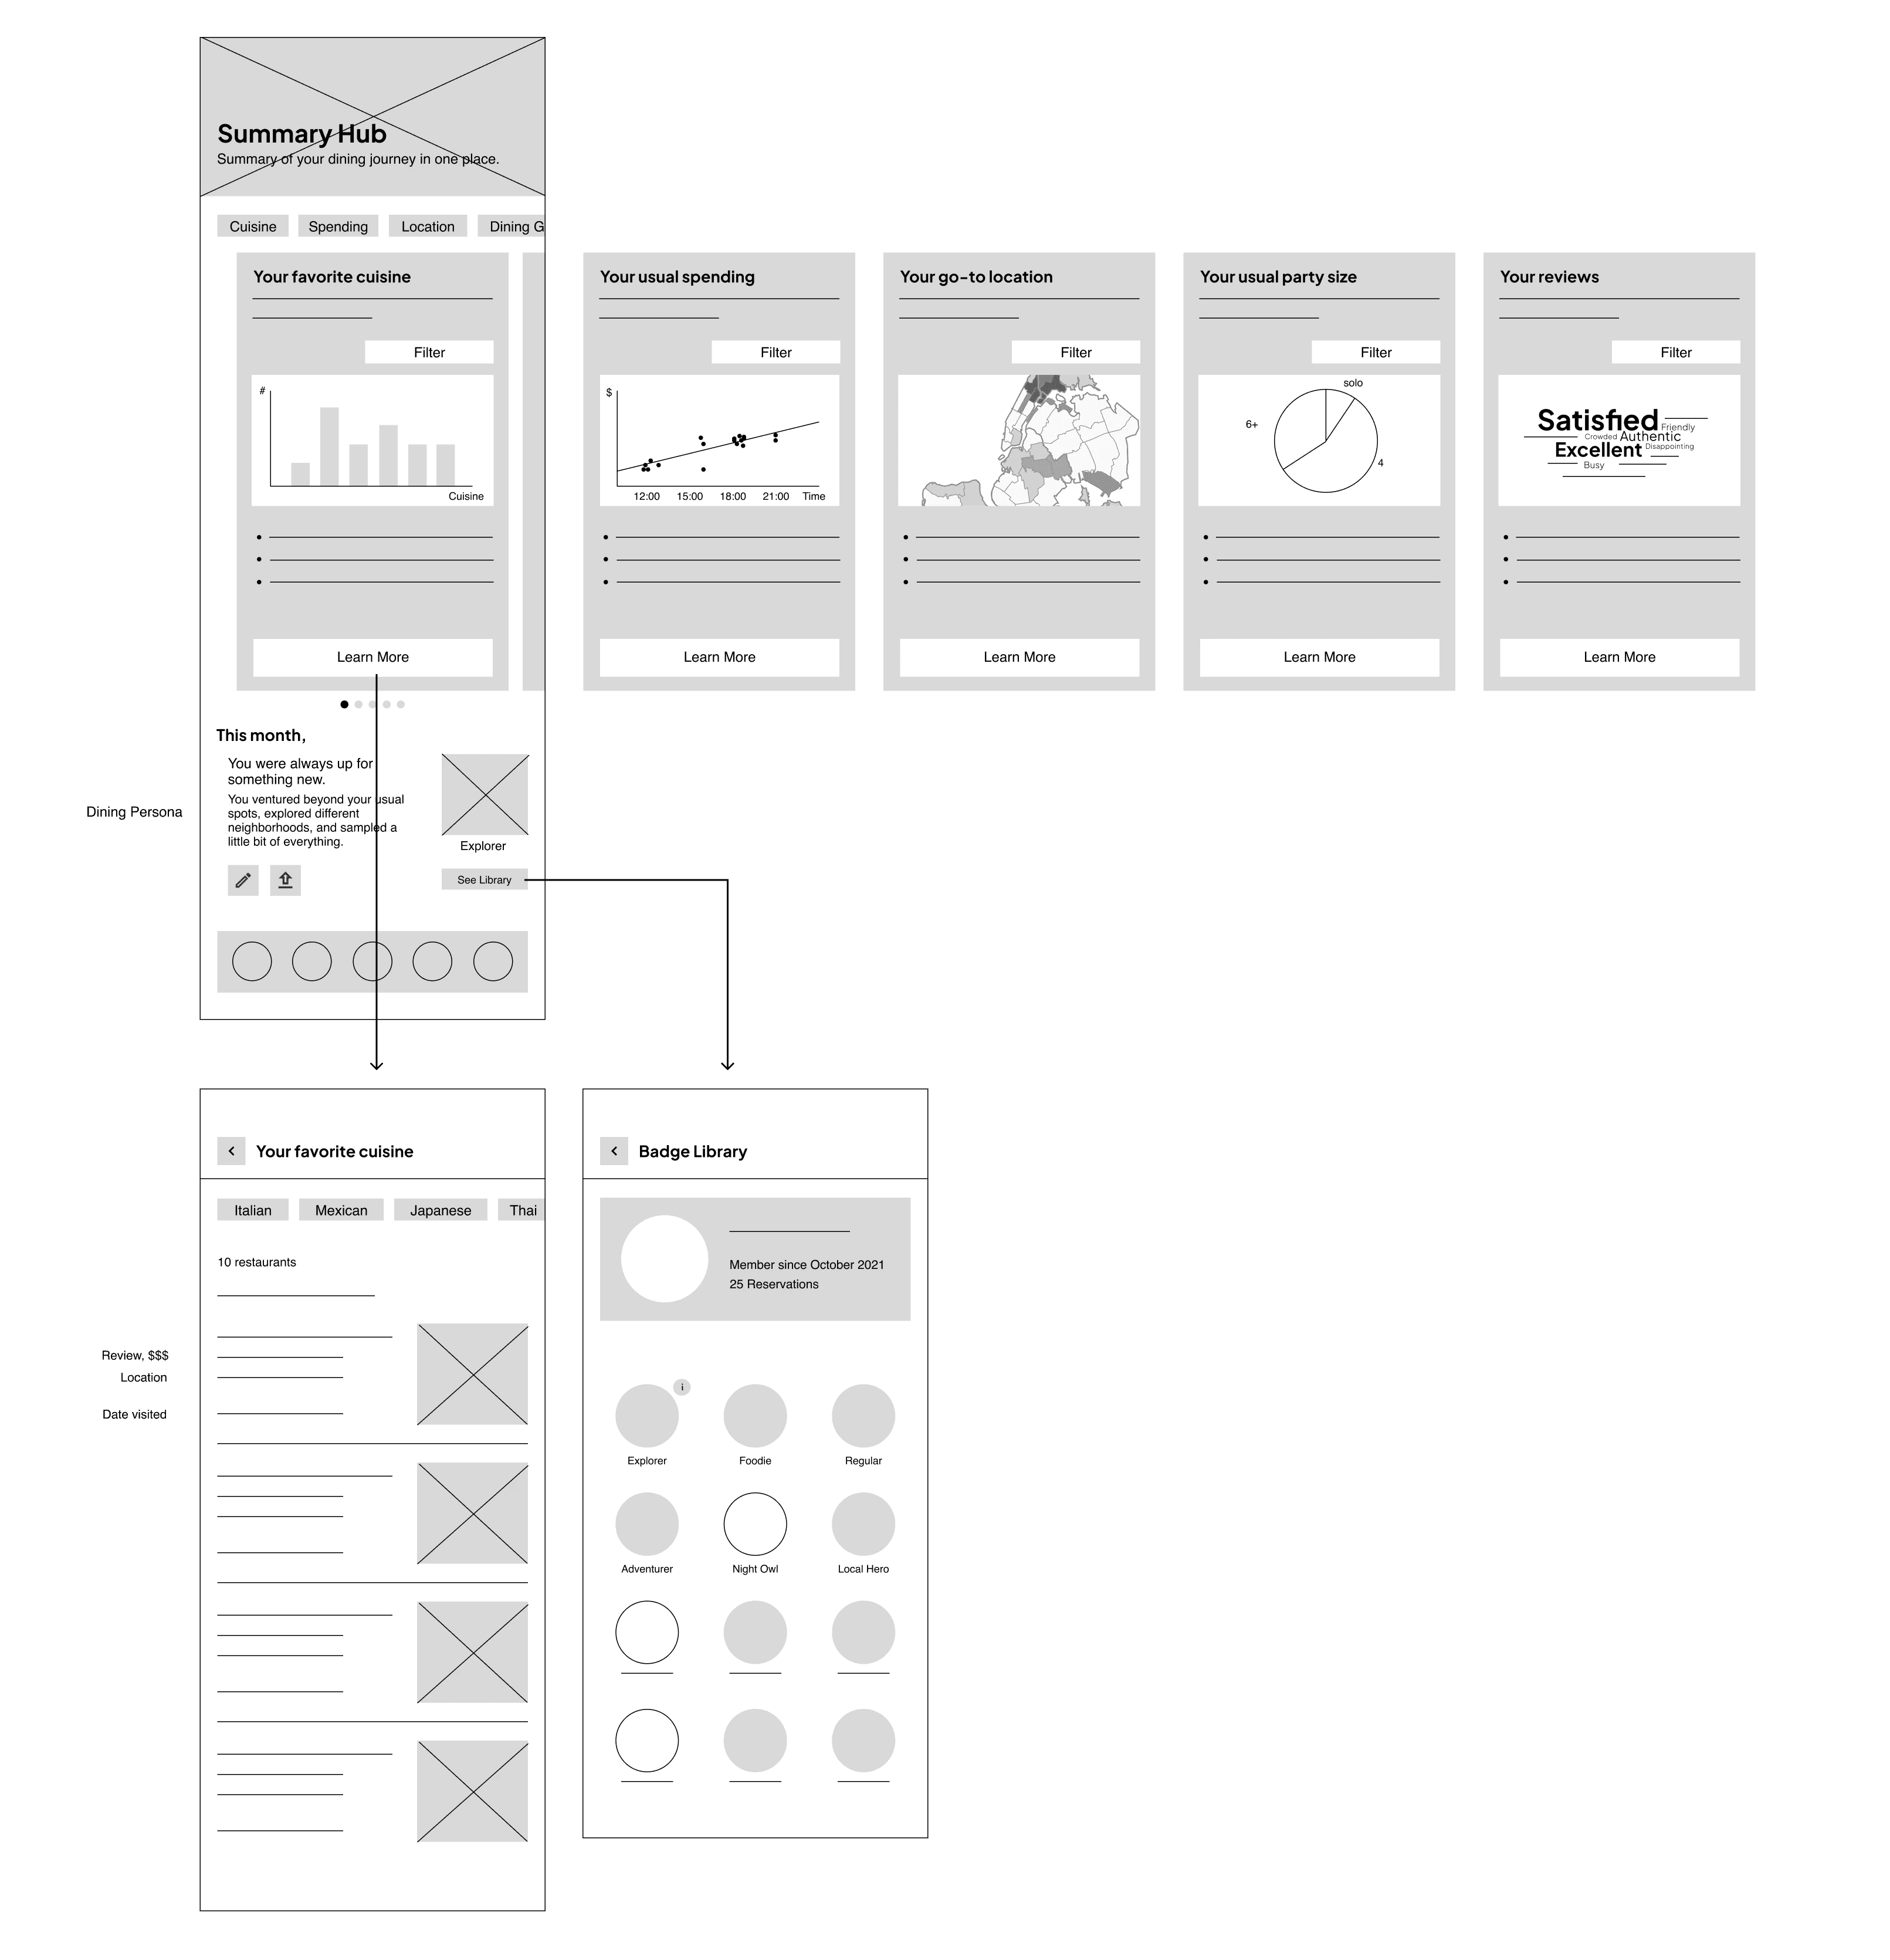
Explored and iterated on data visualization concepts through sketches and digital wireframes.
Summary Hub walkthrough
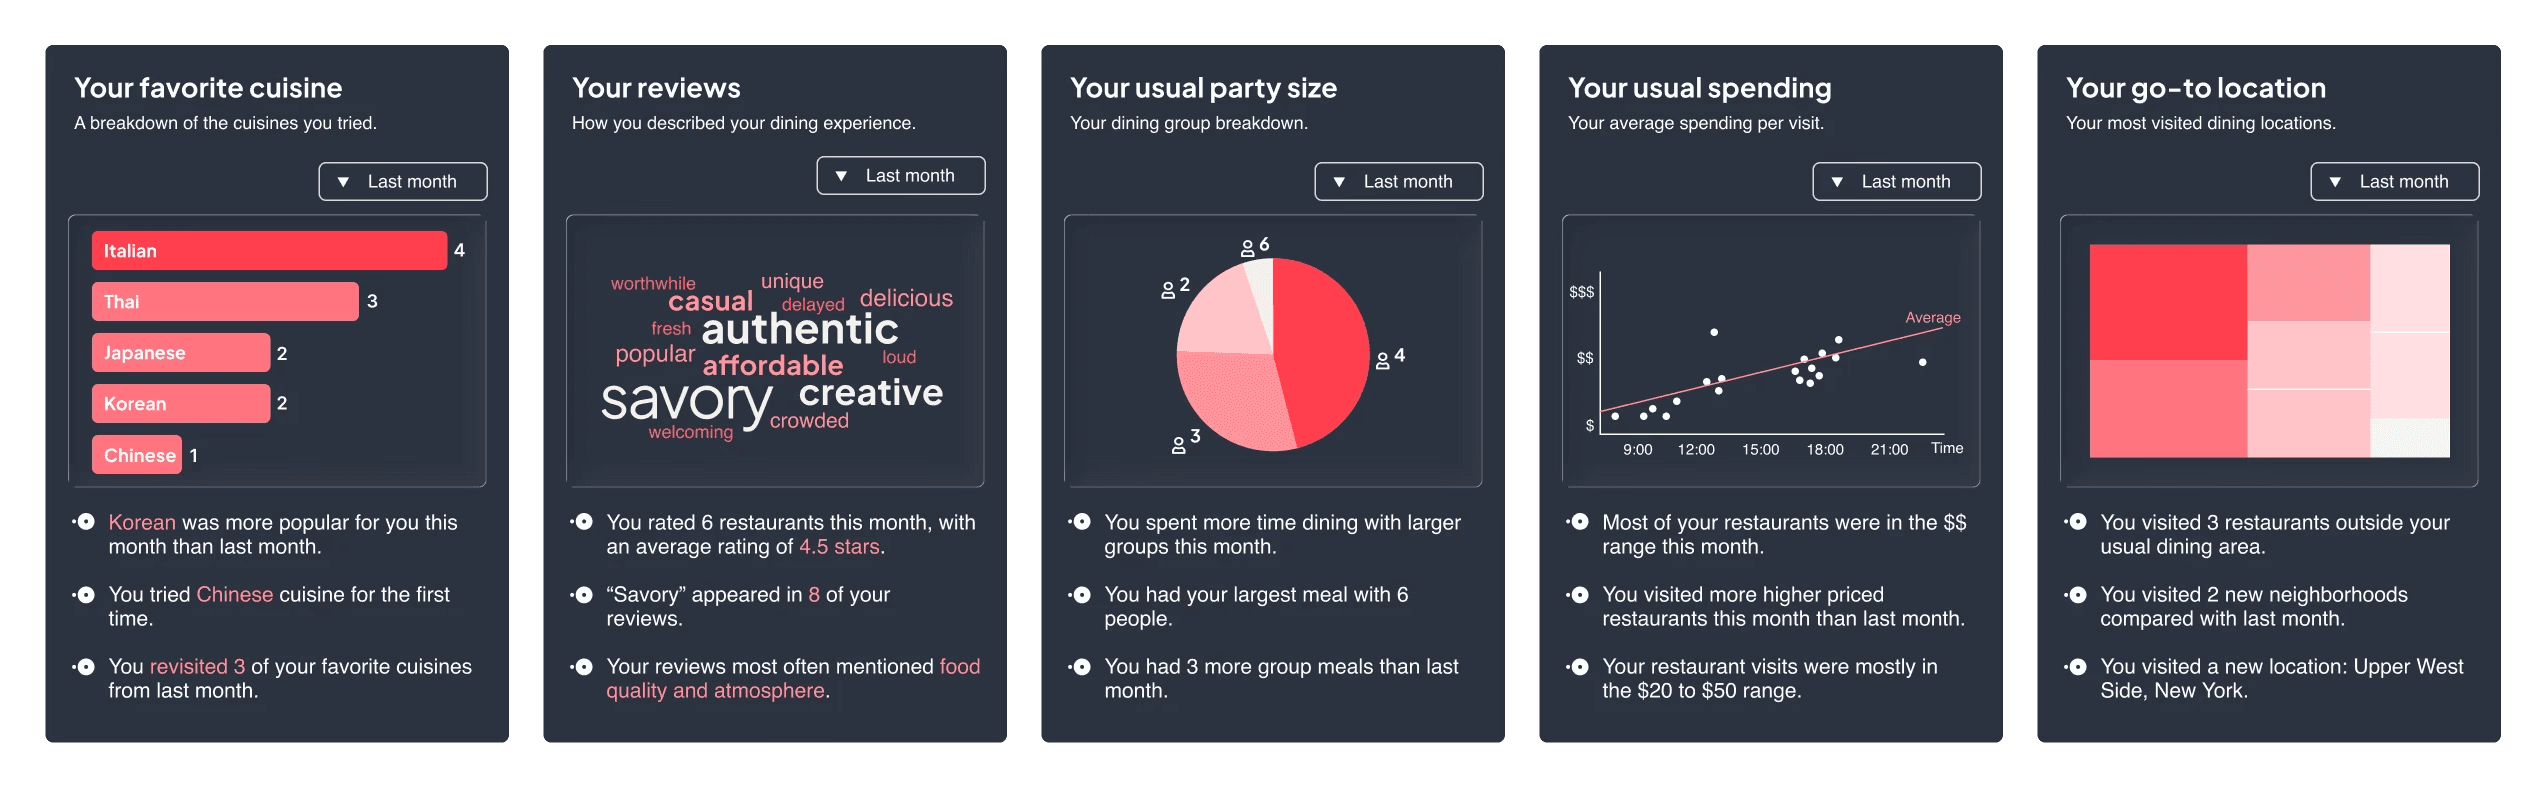
Five detail screens; each with a filter for date, a chart of data visualization, and insight bullets.
Dining Persona & Badge Library
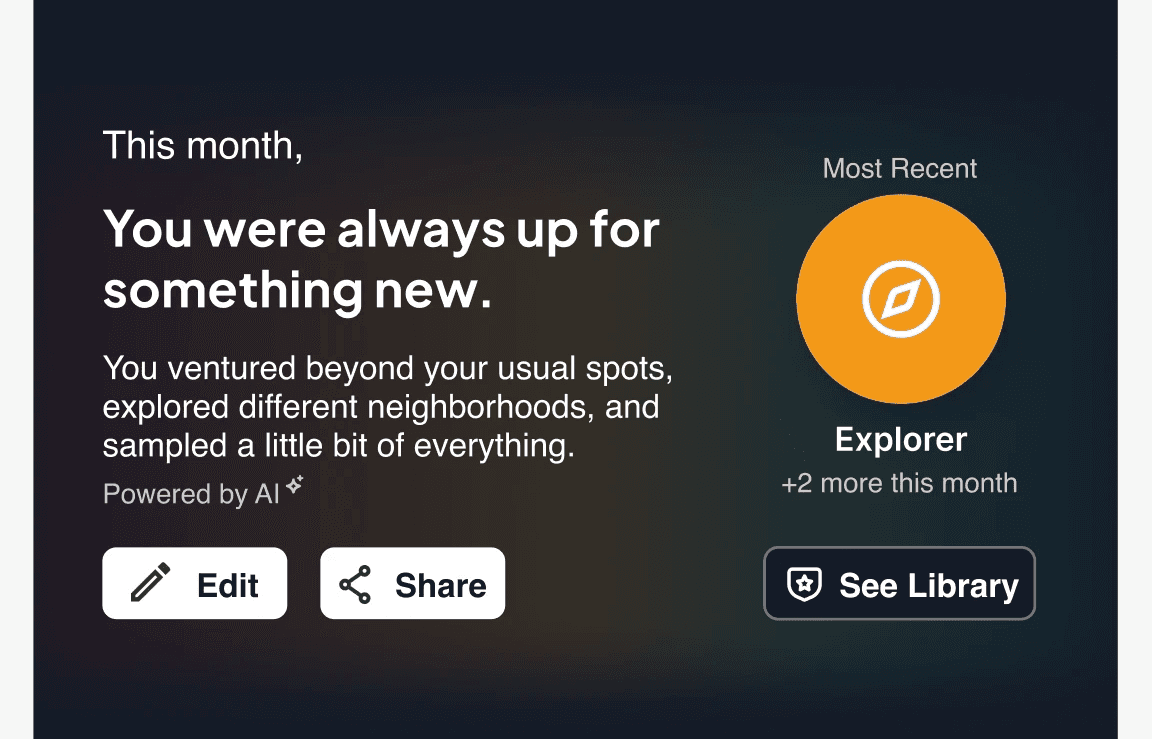
An AI-generated monthly dining persona based on five data visualizations, with options to share achievements socially or manually edit the AI generated summary. 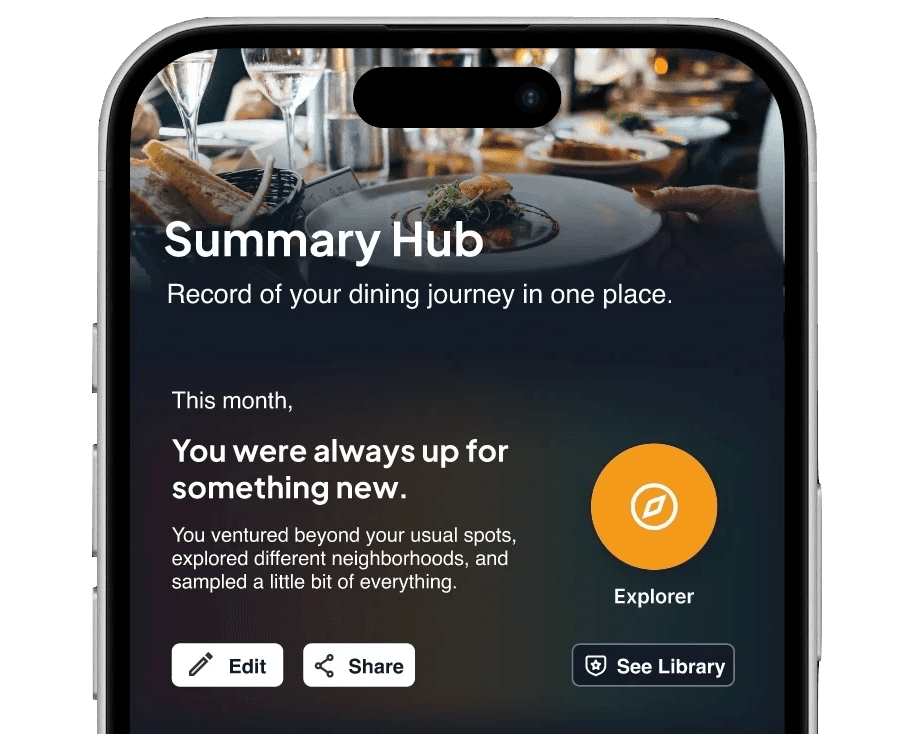 | 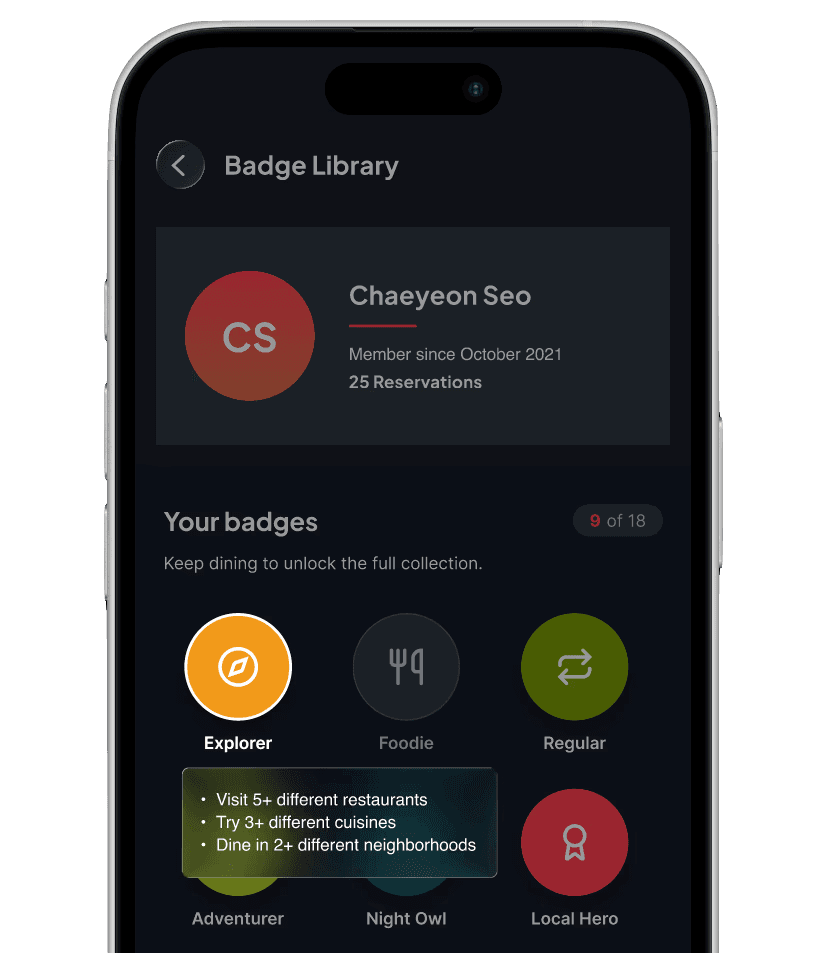 *when one of the badge is selected to see the requirements of the badge in the badge library. |
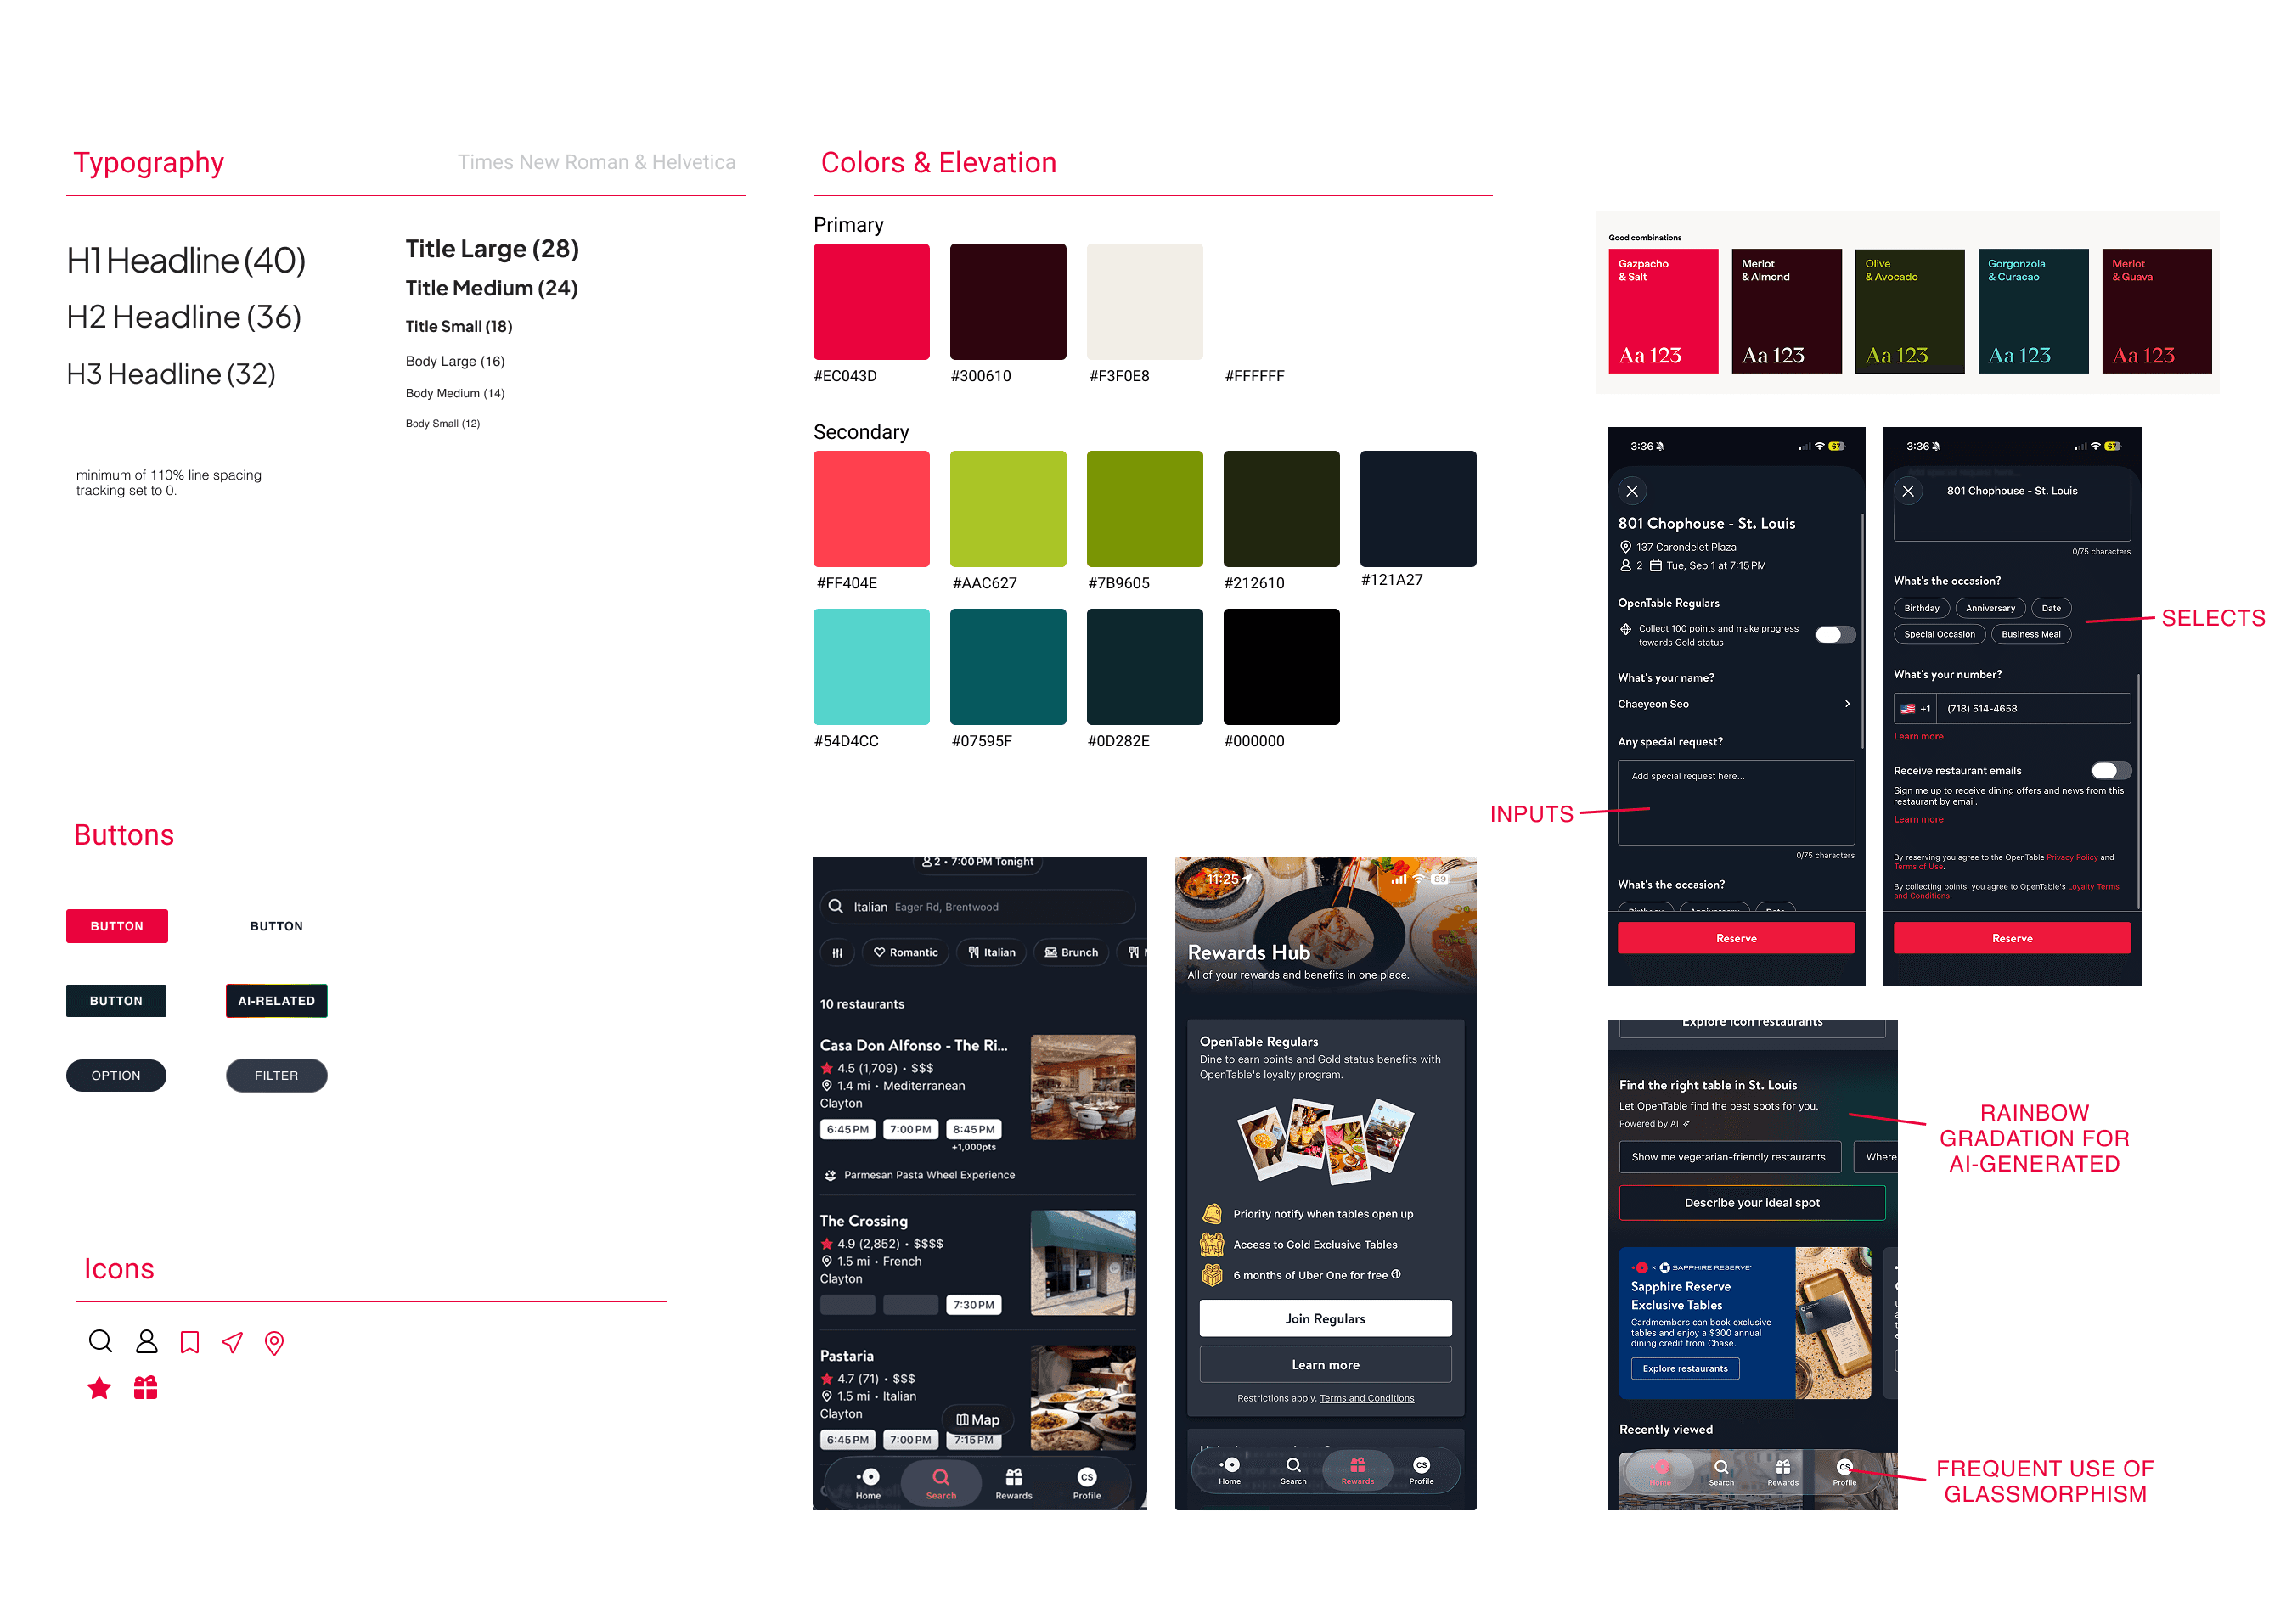
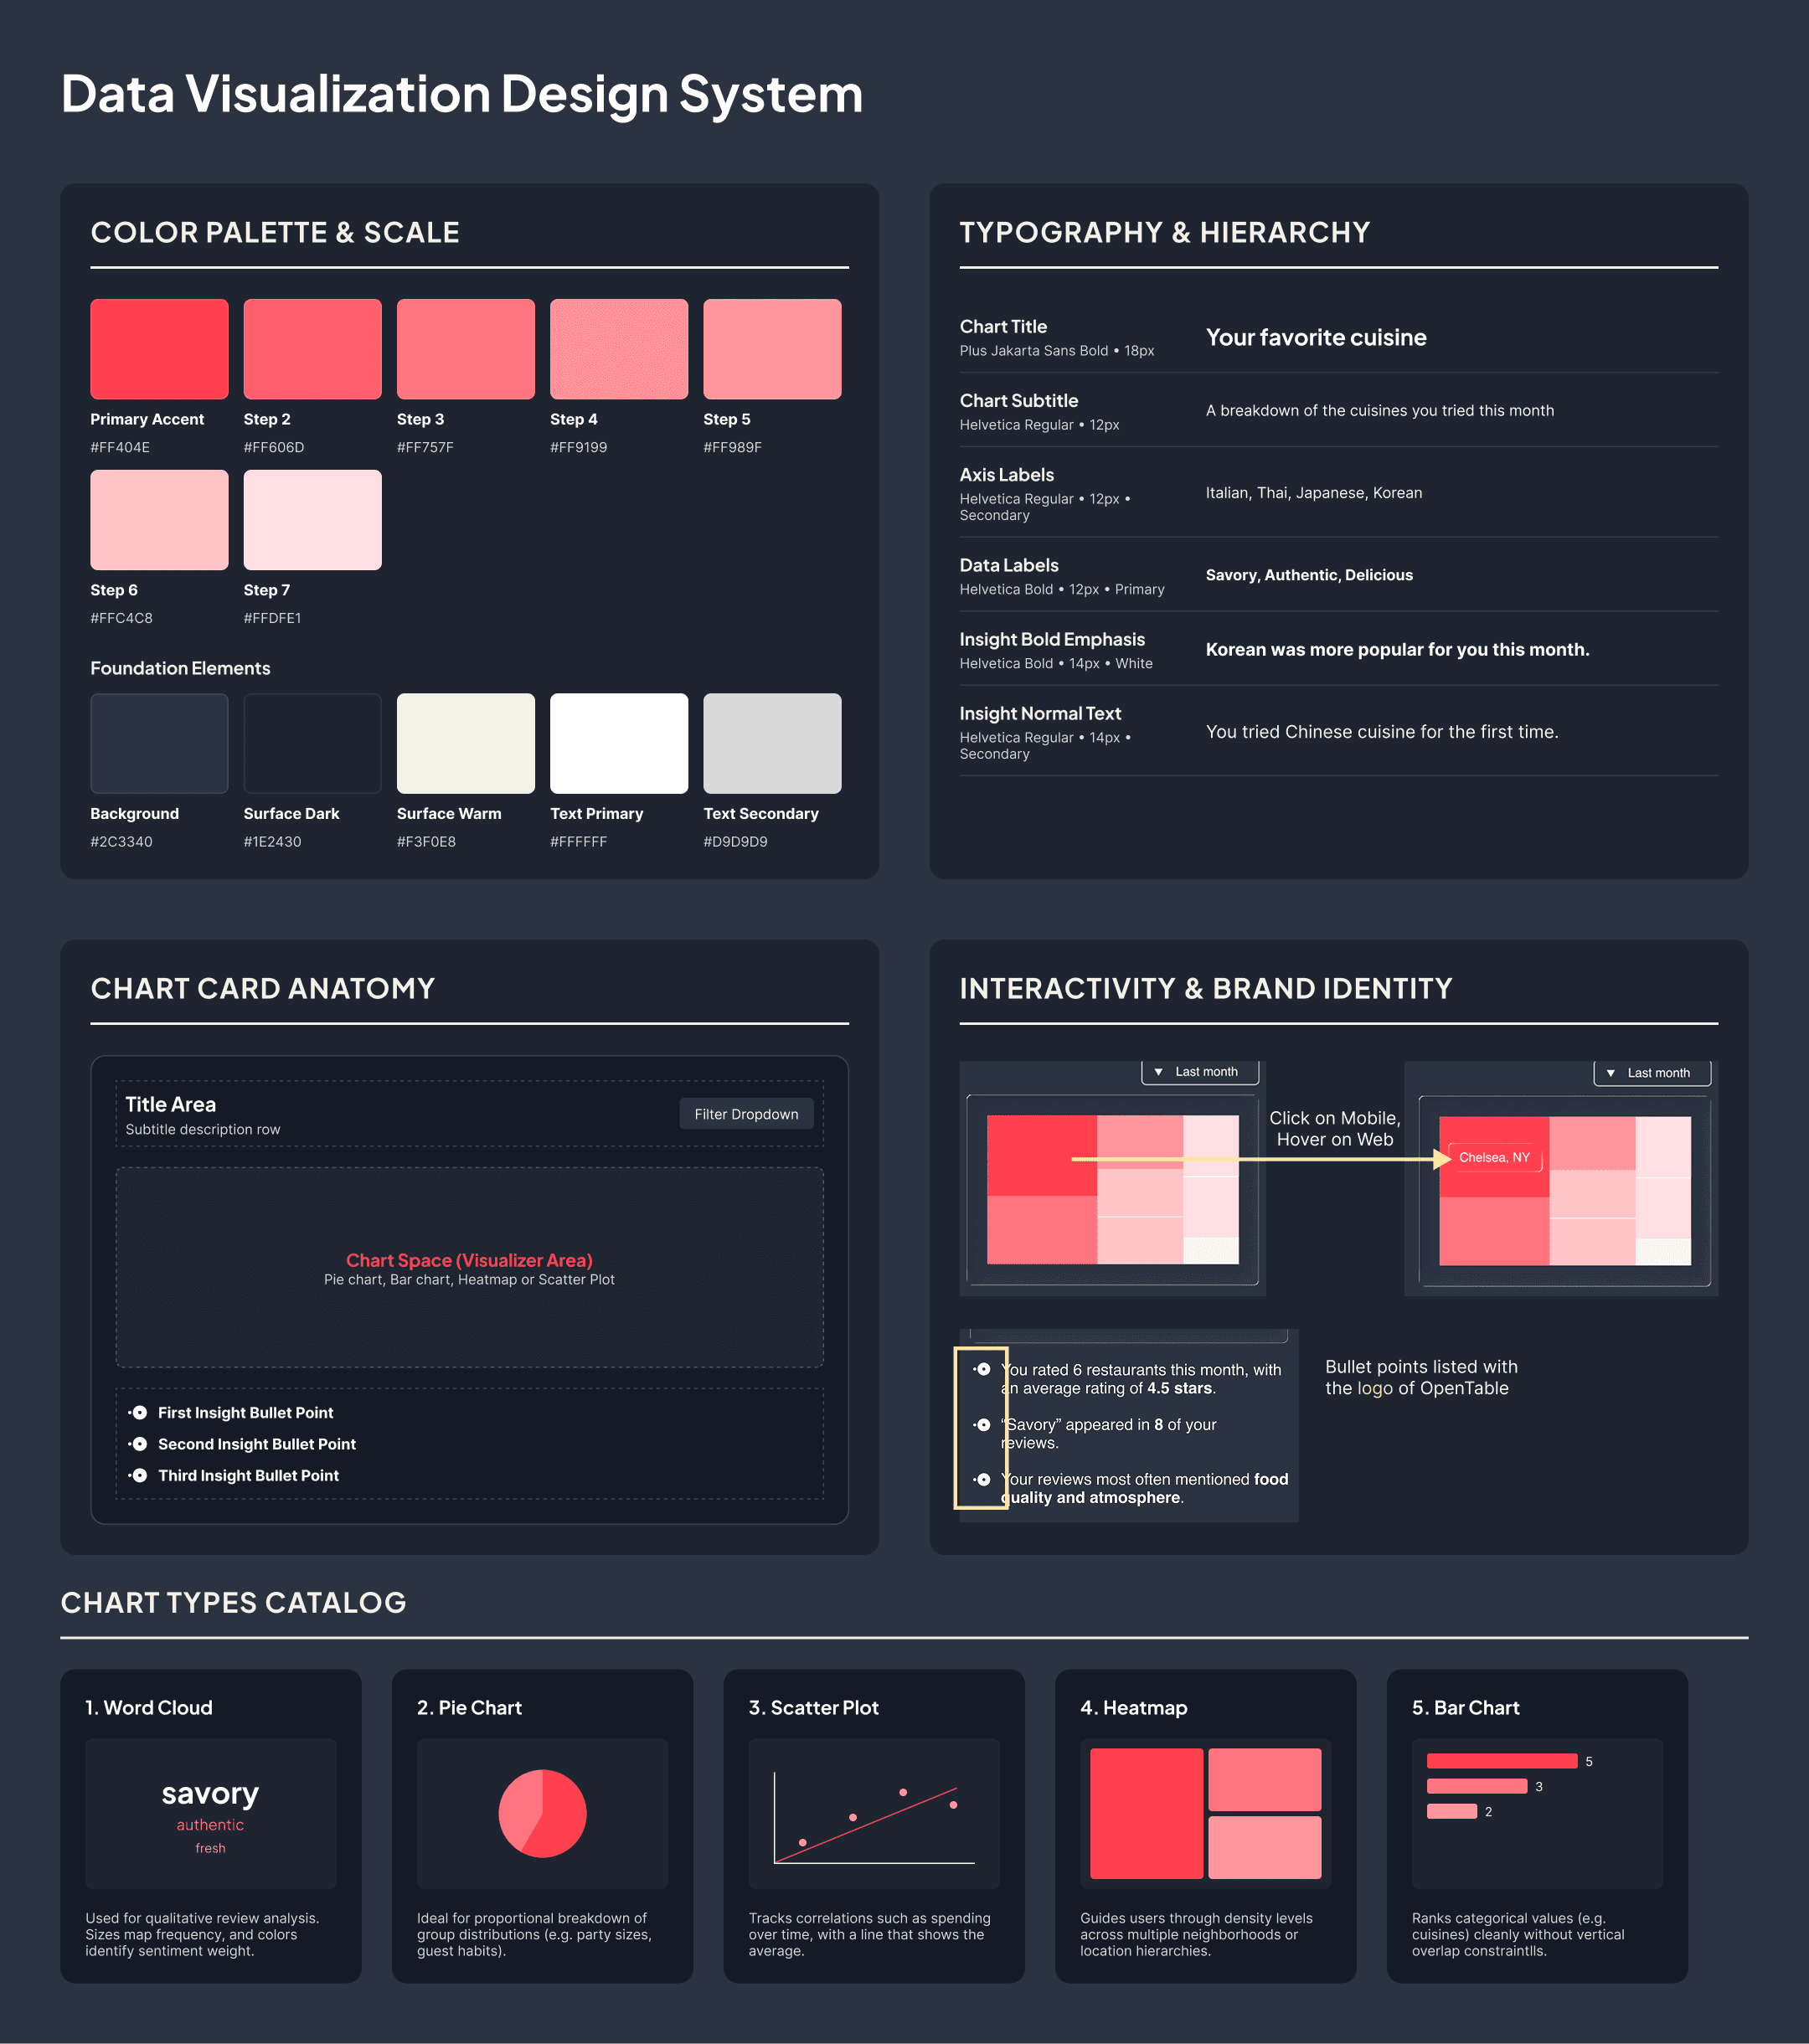
Building on OpenTable's design system
Studied and adapted the existing brand style to create a natural extension of the app.
Refining the Experience
 |  |  |
|---|---|---|
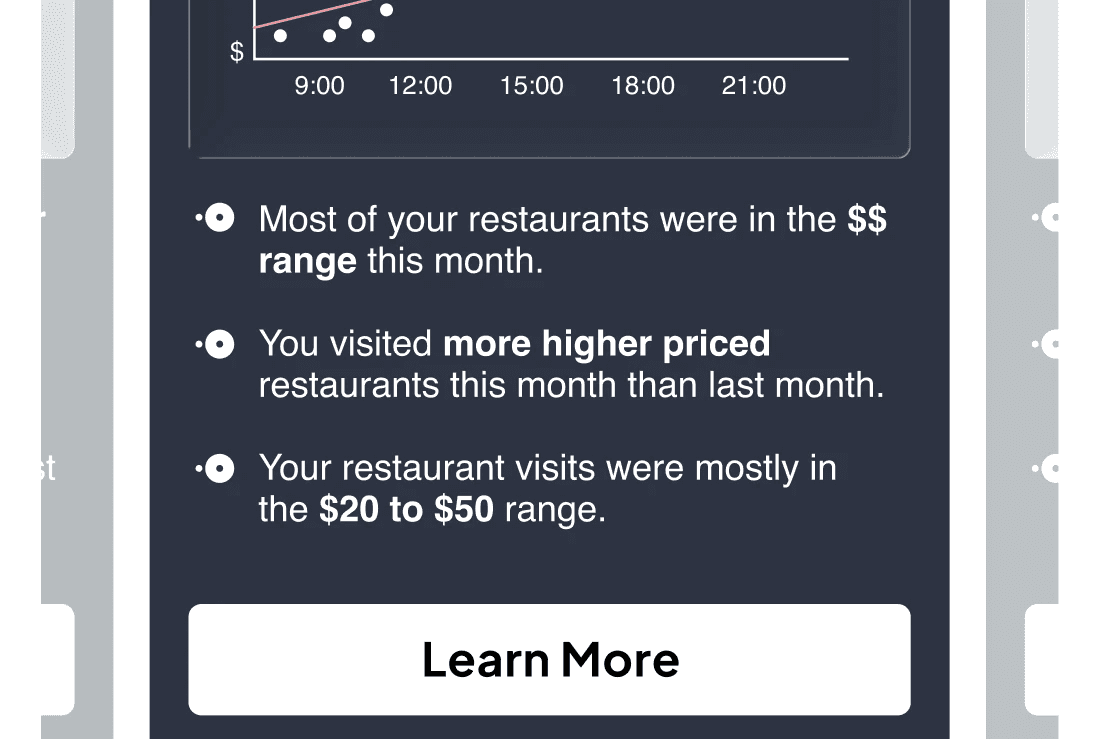
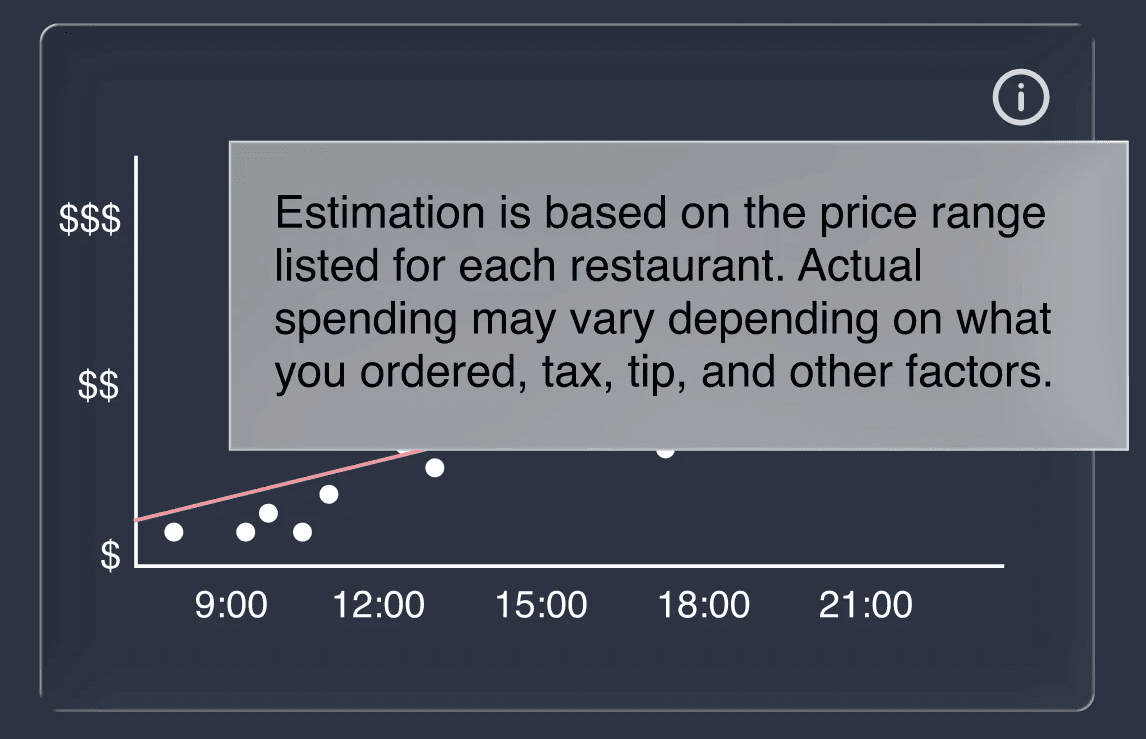
Bullet Points with Logo | Editable AI Summary AI can be inaccurate; users can review and edit the result anytime. | Transparent Estimates Letting the user know that the data is an estimate rather than an exact figure. |
Data VIsualization
Wireframes


Prototype
Takeaways
Impact | Reflection |
|---|---|
The experience transforms past reservations into a snapshot of the user’s dining habits. By surfacing patterns across cuisine, location, spending, reviews, and dining groups, it feels more personal and interesting. Personas and badges add a layer of discovery, turning historical data into something users can engage with. | This project taught me how to turn raw behavioral data into meaningful insights. One of the biggest challenges was how to communicate estimates, such as restaurant price ranges, without presenting them as exact spending. I also learned that personalization can feel more engaging when it gives users a simple way to recognize their own habits rather than trying to predict too much about them. |
More Projects



UI/UX Design & Data Visualization
Reservation Summary Hub for OpenTable
A dining record with personalized personas and badge achievements.
Year :
2026
Industry :
Food & Hospitality
Tool :
Figma
Project Duration :
Sep 2026 - Ongoing
Problem
Many diners use restaurant reservation apps to discover restaurants and make reservations. While the reservation process is straightforward, the experience largely ends once the reservation is made.
This project explores how OpenTable could extend beyond reservations by turning a user’s dining history into a more personal and engaging experience. By bringing past reservations together, the app analyzes patterns to create a personalized dining persona and badges.
Goals
Summarize the Reservation History | Create a Personal Dining Persona | Celebrate with Badge Achievement |
|---|---|---|
Turn scattered history into clear insights about cuisines, locations, spending, dining groups, and review patterns. | Use dining patterns to create a persona that helps users understand how they typically experience restaurants. | Turn dining behaviors into badges that encourage exploration and give users a fun way to track their progress. |
Wireframe: Sketches to Screen
Explored and iterated on data visualization concepts through sketches and digital wireframes.
Summary Hub walkthrough
Five detail screens; each with a filter for date, a chart of data visualization, and insight bullets.
Dining Persona & Badge Library
An AI-generated monthly dining persona based on five data visualizations, with options to share achievements socially or manually edit the AI generated summary. | *when one of the badge is selected to see the requirements of the badge in the badge library. |
Building on OpenTable's design system
Studied and adapted the existing brand style to create a natural extension of the app.
Refining the Experience
| | |
|---|---|---|
Bullet Points with Logo | Editable AI Summary AI can be inaccurate; users can review and edit the result anytime. | Transparent Estimates Letting the user know that the data is an estimate rather than an exact figure. |
Data VIsualization
Wireframes
Prototype
Takeaways
Impact | Reflection |
|---|---|
The experience transforms past reservations into a snapshot of the user’s dining habits. By surfacing patterns across cuisine, location, spending, reviews, and dining groups, it feels more personal and interesting. Personas and badges add a layer of discovery, turning historical data into something users can engage with. | This project taught me how to turn raw behavioral data into meaningful insights. One of the biggest challenges was how to communicate estimates, such as restaurant price ranges, without presenting them as exact spending. I also learned that personalization can feel more engaging when it gives users a simple way to recognize their own habits rather than trying to predict too much about them. |
More Projects
UI/UX Design & Data Visualization
Reservation Summary Hub for OpenTable
A dining record with personalized personas and badge achievements.
Year :
2026
Industry :
Food & Hospitality
Tool :
Figma
Project Duration :
Sep 2026 - Ongoing
Problem
Many diners use restaurant reservation apps to discover restaurants and make reservations. While the reservation process is straightforward, the experience largely ends once the reservation is made.
This project explores how OpenTable could extend beyond reservations by turning a user’s dining history into a more personal and engaging experience. By bringing past reservations together, the app analyzes patterns to create a personalized dining persona and badges.
Goals
Summarize the Reservation History | Create a Personal Dining Persona | Celebrate with Badge Achievement |
|---|---|---|
Turn scattered history into clear insights about cuisines, locations, spending, dining groups, and review patterns. | Use dining patterns to create a persona that helps users understand how they typically experience restaurants. | Turn dining behaviors into badges that encourage exploration and give users a fun way to track their progress. |
Wireframe: Sketches to Screen
Explored and iterated on data visualization concepts through sketches and digital wireframes.
Summary Hub walkthrough
Five detail screens; each with a filter for date, a chart of data visualization, and insight bullets.
Dining Persona & Badge Library
An AI-generated monthly dining persona based on five data visualizations, with options to share achievements socially or manually edit the AI generated summary. | *when one of the badge is selected to see the requirements of the badge in the badge library. |
Building on OpenTable's design system
Studied and adapted the existing brand style to create a natural extension of the app.
Refining the Experience
| | |
|---|---|---|
Bullet Points with Logo | Editable AI Summary AI can be inaccurate; users can review and edit the result anytime. | Transparent Estimates Letting the user know that the data is an estimate rather than an exact figure. |
Data VIsualization
Wireframes
Prototype
Takeaways
Impact | Reflection |
|---|---|
The experience transforms past reservations into a snapshot of the user’s dining habits. By surfacing patterns across cuisine, location, spending, reviews, and dining groups, it feels more personal and interesting. Personas and badges add a layer of discovery, turning historical data into something users can engage with. | This project taught me how to turn raw behavioral data into meaningful insights. One of the biggest challenges was how to communicate estimates, such as restaurant price ranges, without presenting them as exact spending. I also learned that personalization can feel more engaging when it gives users a simple way to recognize their own habits rather than trying to predict too much about them. |